常用命令
-x 扩展信息
-m 使用MB单位
命令后跟数字x y 每x秒刷新, 显示y次
#每隔 2 秒显示一次详细的设备统计信息,共显示 5 次。

iostat -x 2 5
-c 显示cpu相关的信息
-p 指定特定设备信息,比如-p sda只展示sda下的\
指标
基本指标
- Device: 设备名称,例如
sda表示第一个SCSI磁盘设备。
-x 扩展信息
-m 使用MB单位
命令后跟数字x y 每x秒刷新, 显示y次
#每隔 2 秒显示一次详细的设备统计信息,共显示 5 次。 |
-c 显示cpu相关的信息
-p 指定特定设备信息,比如-p sda只展示sda下的\
sda 表示第一个SCSI磁盘设备。确保已安装 perf 和 FlameGraph 工具。
FlameGraph 通过以下命令下载
git clone https://github.com/brendangregg/FlameGraph.git |
perf 是一个强大的 Linux 性能分析工具,它可以用来收集和分析性能数据。
perf的命令有很多,下文将就其中常用的几条进行阐述
|
linux_binfmt 用来定义二进制格式的结构,代表某种 特定的格式,比如elf
struct linux_binfmt { |
linux_binprm 用来存放可执行 文件的各种参数,代表可执行文件的运行时结构
fuser 是一个非常有用的工具,可以用来查看哪些进程正在使用特定的文件、目录、或者端口。你也可以用它来查找和终止访问特定二进制文件的进程。
格式如下,如启动了一个端口为8080的tcp服务进程
sudo fuser 8080/tcp |
Wirewhark利用ssh/nc实现抓取Linux的网络包
Wireshark是一个开源的网络数据包分析器,可以实时的从网络接口捕获数据包并分析。他支持多种协议类型,是最为流行的数据包分析器。
Wireshark支持Mac和Windows版本,但是对于Linux服务器上的包,以往只能通过服务器上tcpdump后,去离线分析数据包,较为不便。
之前的文章讲过利用rpcapd实现远程抓包https://blogs.92ac.cn/2024/08/06/rpcapd/, 这种方式要求在服务器上额外编译安装rpcapd。
这里再介绍其他的几种方式。
问题起因是git clone 代码的时候,发现会卡住拉取不下来
因此边使用telnet工具去测试一下端口是否是通的
telnet github.com 22 |
如果端口通的,应该会如下图展示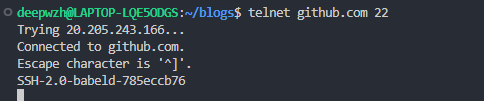
否则端口是不通的。
Wirewhark利用rpcapd实现抓取Linux的网络包
Wireshark是一个开源的网络数据包分析器,可以实时的从网络接口捕获数据包并分析。他支持多种协议类型,是最为流行的数据包分析器。
Wireshark支持Mac和Windows版本,但是对于Linux服务器上的包,以往只能通过服务器上tcpdump后,去离线分析数据包,较为不便。
这次要推荐的一个工具叫做rpcapd, 他现是libpcap的一部分,可以用于实时远程抓包。